
In This Article
Overview
The Risk Report provides a comprehensive view of all risks recorded across ideas/initiatives in the system. This report helps users identify, assess, and monitor potential issues that could impact the successful implementation of ideas/initiatives by displaying risks with their associated consequence, probability, and severity ratings. The report presents both a visual Risk Matrix and a detailed table view, making it easy to prioritize risk management efforts and ensure appropriate mitigation strategies are in place.
Risk management is crucial in project management because it helps identify, assess, and mitigate potential problems that could impact the success of a project. The Risk Report consolidates all risks from across the organization, providing visibility into risk exposure and enabling proactive risk management.
The report is particularly useful for identifying high-severity risks requiring immediate attention, monitoring risk trends across the organization, ensuring risks have appropriate management strategies, tracking risk ownership and accountability, and supporting strategic decision-making.
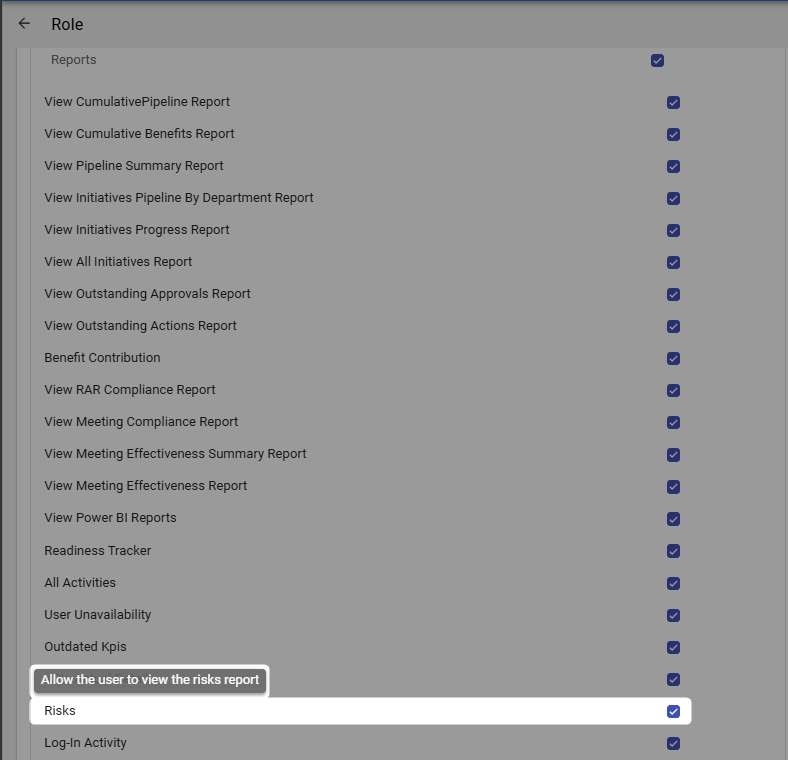
Note: Users need the Risks permission enabled in their role under Reports to be able to access and use this report. If you cannot view this report, please contact your system administrator to verify your permissions.
Accessing the Risk Report
To access the Risk Report:
- Navigate to the Reports module from the top navigation bar
- Select Risks from the list of available reports
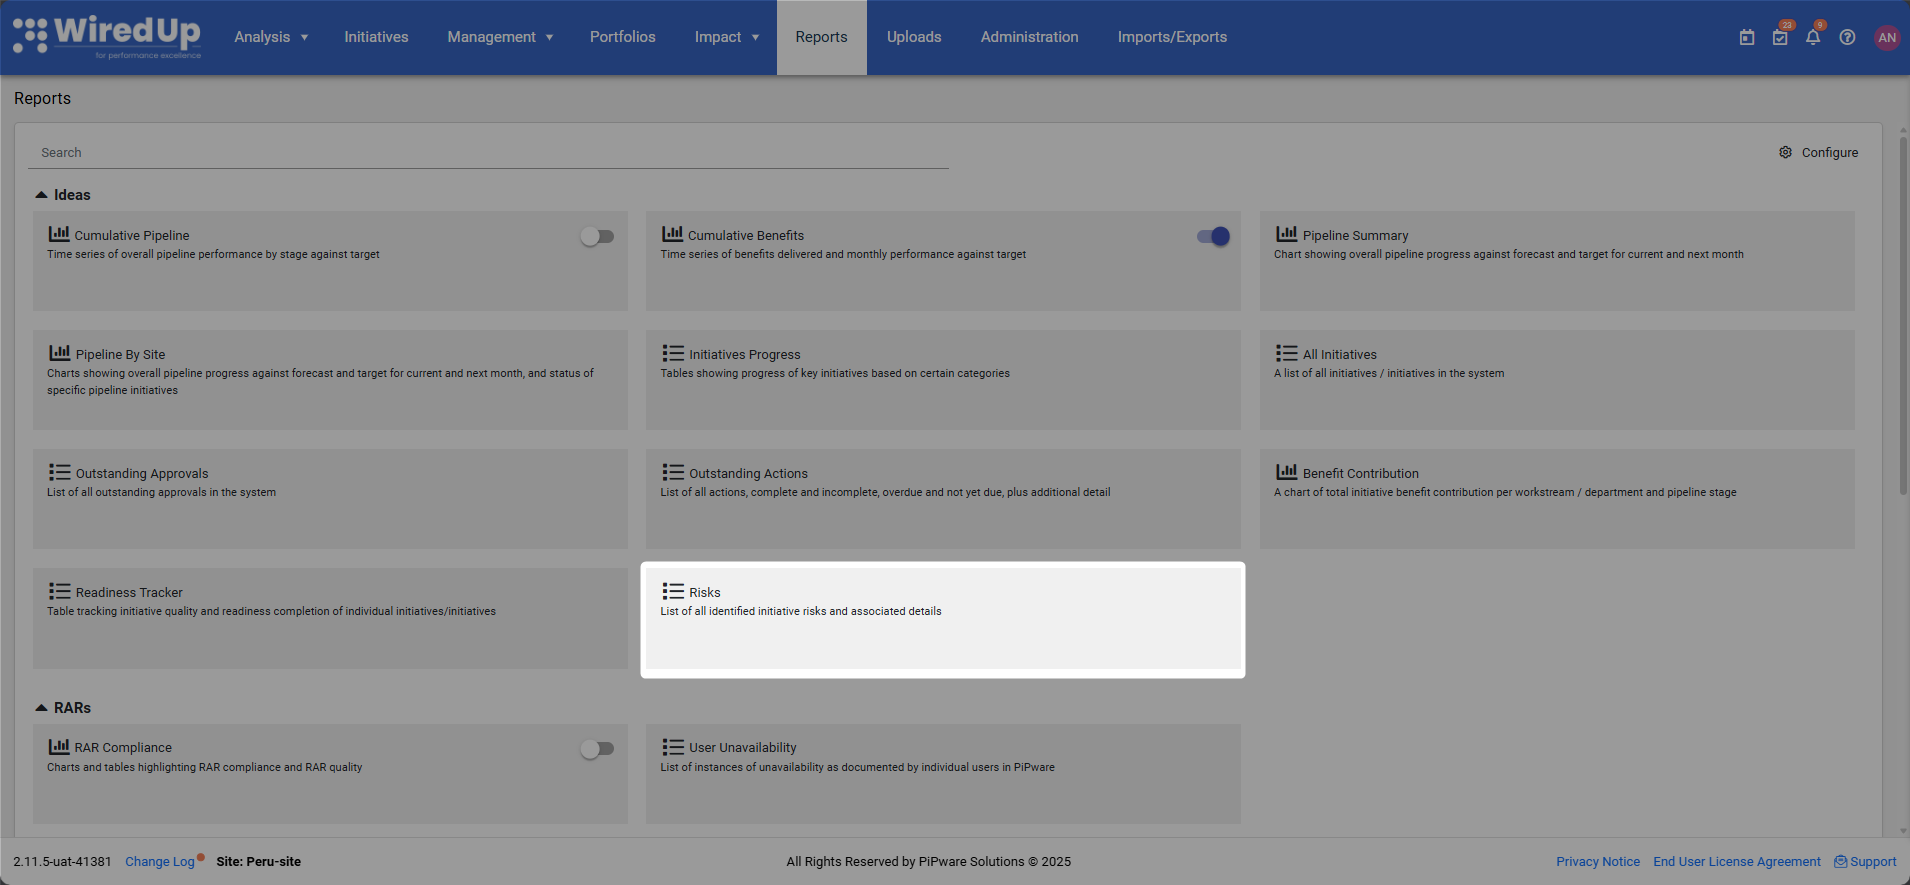
- The report will display with default filters applied, showing the risk table. The Risk Matrix is hidden by default but can be toggled on for visual analysis
Understanding the Report
The Risk Report consists of two main components: a visual Risk Matrix and a detailed risk table.
Risk Matrix
The Risk Matrix provides a visual representation of risks based on their probability and consequence ratings:
- Toggle Control: Use the Risk Matrix toggle switch at the top of the report to show or hide the matrix visualization
- Color-Coded Grid: The matrix displays risks in a grid format with:
- Vertical Axis (Probability): Displays probability levels as configured in your organization's Severity Matrix
- Horizontal Axis (Consequence): Displays consequence levels as configured in your organization's Severity Matrix
- Color Coding: Cells are color-coded to indicate risk severity levels based on your organization's configuration
- Risk Count: Each cell displays the number of risks that fall into that probability/consequence combination
- Configuration: The Risk Matrix, including probability ranges, consequence levels, severity ratings, and color coding, is configured in Administration > Severity Matrix under the Risk group
Risk Table
Below the Risk Matrix, a detailed table displays comprehensive information about each risk:
Table Columns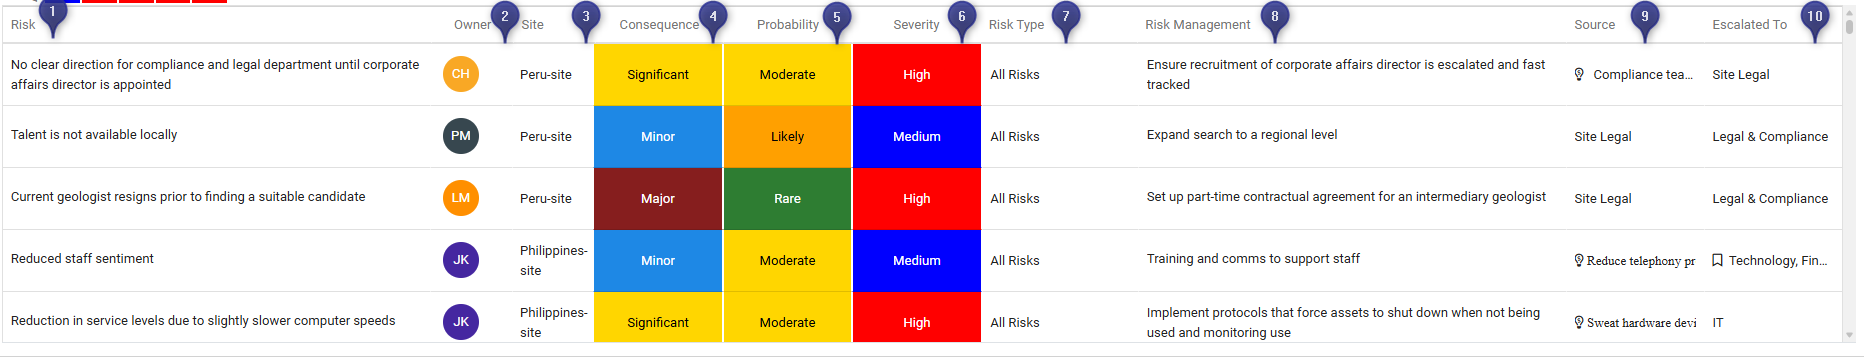
- Risk: Description of the risk and its potential impact on the idea/initiative
- Owner: The person responsible for managing and monitoring the risk (displayed with initials in a colored circle)
- Site: The portfolio, department, or site where the risk is recorded
- Consequence: The potential impact or severity of the risk if it occurs (e.g., Insignificant, Minor, Major, Severe)
- Probability: The likelihood of the risk occurring (e.g., Unlikely, Moderate, Almost Certain)
- Severity: The overall risk rating calculated based on consequence and probability (e.g., Very Low, Low, Medium, High, Very High), displayed with color coding
- Risk Type: The category of the risk (e.g., Health/Safety/Environmental Risks, Business/Financial Risks)
- Risk Management: The strategy or actions planned to mitigate or manage the risk
- Source: The idea/initiative to which the risk is associated. Click on the source items to navigate directly to the idea/initiative details
- Escalated To: The portfolio or organizational level to which the risk has been escalated (available for PMO users only). Click on the escalated portfolio to navigate to the Portfolios module
Note: Consequence, Probability, Severity, and Risk Type are all configured in Administration under the Risk group.
Table Features
- Sorting: Click on the following column headers to sort the table: Owner, Site, Consequence, Probability, Severity, Risk Type, Source, and Escalated To
- Color Coding: The Consequence, Probability, and Severity columns use color coding to provide quick visual identification of risk levels based on your organization's configuration
- Navigation: Click on items in the Source column to navigate to the associated idea/initiative, or click on items in the Escalated To column to navigate to the relevant portfolio (only available on PMO)
Report Filters
The Risk Report includes several filters to customize the data displayed. These filters appear in the Filter panel on the right side of the screen when you click the Filter button.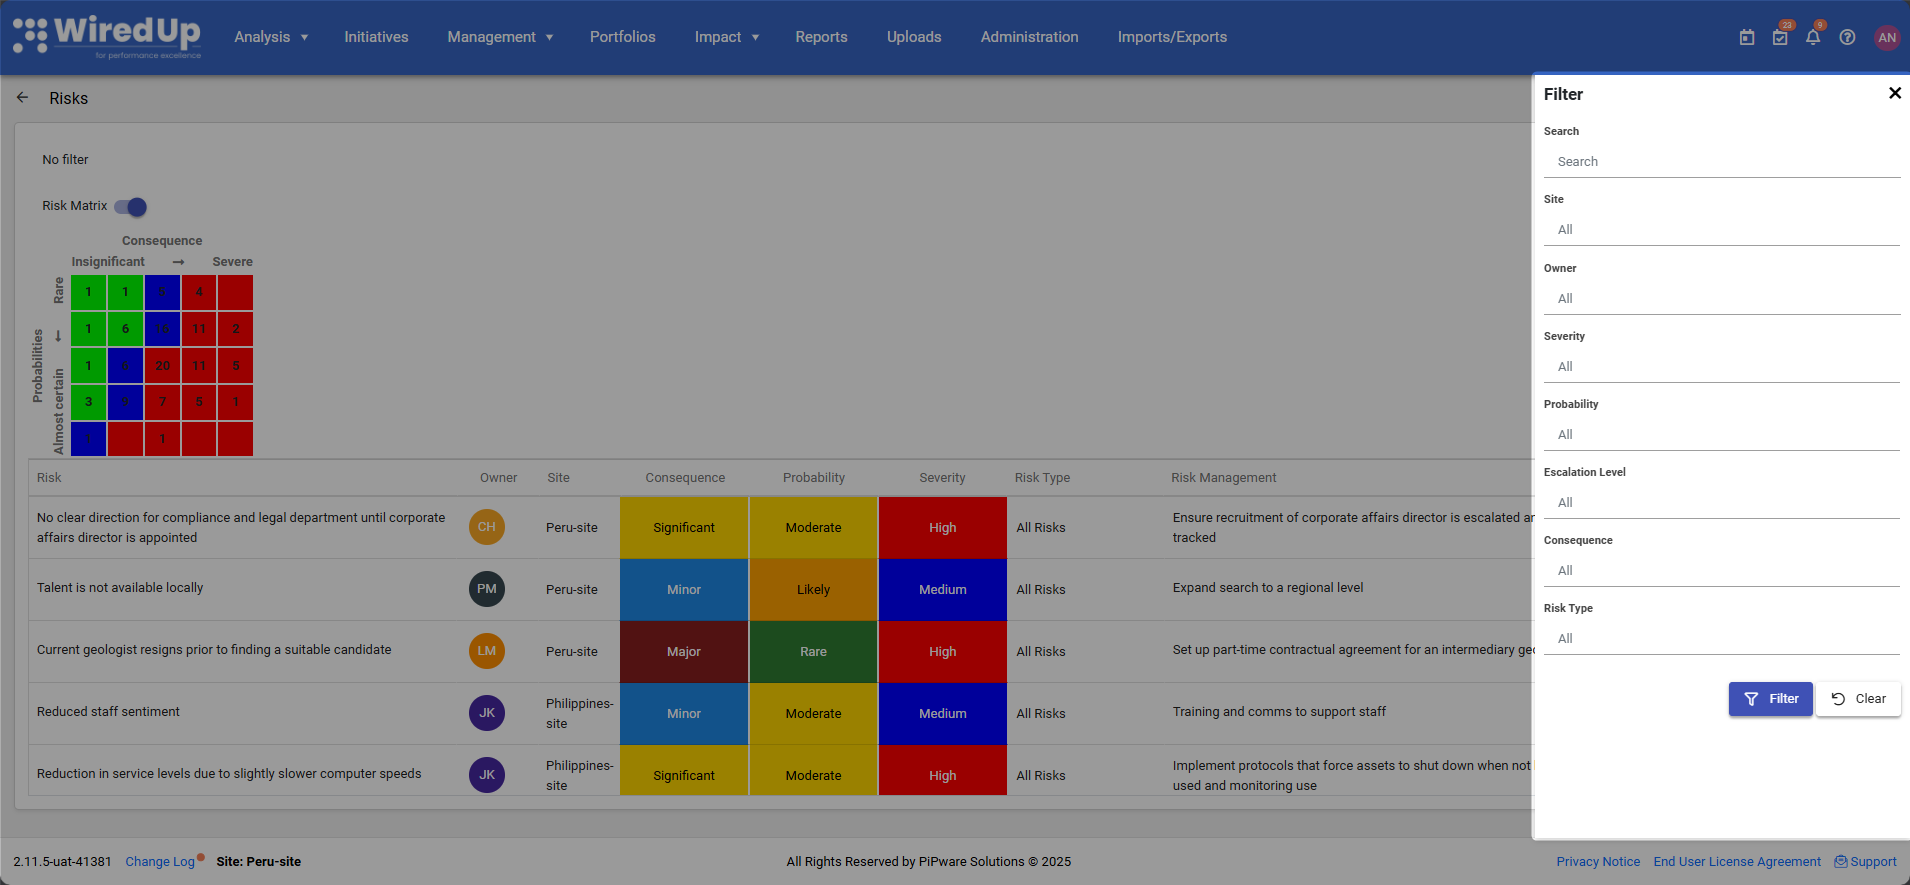
Applying and Clearing Filters:
- Click the Filter button (top-right corner) to apply your selected filter criteria
- Click the Clear button to reset all filters to their default values
- When no filters are applied, the message "No filter" appears at the top of the report
- Once filters have been applied, they will be displayed at the top of the report in a summary Showing the selected filter criteria
Available Filters:
Search
- Enter text to search for specific risks by description or keywords
- Helps quickly locate particular risks in the list
Site
- Select the specific Site to view
- Default setting shows "All" sites
- Allows you to focus on risks from specific organizational areas
Owner
- Filter risks by the assigned owner
- Default setting shows "All" owners
- Helps track risks assigned to specific individuals or teams
Severity
- Filter by risk severity level (e.g., Very Low, Low, Medium, High, Very High)
- Default setting shows "All" severity levels
- Useful for focusing on high-priority risks requiring immediate attention
Probability
- Filter by the likelihood of the risk occurring (e.g., Rare, Unlikely, Moderate, Likely, Almost Certain)
- Default setting shows "All" probability levels
- Helps identify risks with high likelihood of occurrence
Escalation Level
- Filter by the organizational or portfolio level to which risks have been escalated (e.g., Team, Workstream, Program, Site)
- Default setting shows "All" escalation levels
- Useful for tracking escalated risks requiring attention at different organizational levels
Consequence
- Filter by the potential impact of the risk (e.g., Insignificant, Minor, Major, Severe)
- Default setting shows "All" consequence levels
- Helps prioritize risks based on their potential impact
Risk Type
- Filter by risk category (e.g., Health/Safety/Environmental Risks, Business/Financial Risks)
- Default setting shows "All" risk types
- Useful for focusing on specific categories of risks
Downloading the Report
The Risk Report can be exported for offline viewing, sharing, or further analysis:
- Click the Download button in the top-right corner of the report
- The report will be exported in Excel format
- The downloaded file will include all currently applied filters and all visible risk data
The Excel export allows you to:
- Perform additional analysis on risk data
- Share the report with stakeholders who may not have system access
- Track risk trends over time by saving periodic exports
- Create custom risk dashboards or presentations using the exported data
- Conduct risk assessments and reviews offline
- Maintain historical records of organizational risk exposure
Best Practices
- Review the report regularly to monitor risk exposure across the organization and ensure risks are being actively managed
- Use the Risk Matrix to quickly identify areas of high risk concentration and prioritize risk management efforts
- Sort by Severity to focus on the highest-priority risks requiring immediate attention and mitigation
- Filter by Site or Owner to analyze risk management performance across different areas or individuals
- Check Risk Management strategies to ensure all risks have documented mitigation plans
- Use Probability and Consequence filters together to identify specific risk profiles (e.g., high probability + high consequence)
- Track escalated risks using the Escalated To column to ensure appropriate senior management visibility
- Download and archive reports periodically to maintain historical records of risk trends and management effectiveness
- Use the report in risk review meetings to discuss risk status and identify areas requiring additional resources or attention
- Ensure risk ownership is clearly assigned by reviewing the Owner column and following up on unassigned risks
- Compare Risk Types to identify patterns or systemic issues requiring organizational-level interventions
- Validate risk ratings regularly to ensure Consequence and Probability assessments remain accurate as projects progress
Related Articles
You may also find these related articles helpful:
- Idea Risk
- Ideas/Initiative Progress Report
- Outstanding Approvals Report
- Administration - Risk Configuration