
In This Article
Accessing the All Ideas/Initiatives Report
Overview
The All Ideas Report provides a comprehensive list of all ideas/initiatives in the pipeline with summarized value information including potential value, benefits, and investments required. This report helps users get a complete overview of all ideas/initiatives across the organization, track key financial metrics, and analyze the overall portfolio of ideas/initiatives. The report displays essential information in a table format with customizable columns, making it easy to focus on the most relevant data for your needs.
The report is particularly useful for portfolio management, tracking ideas/initiatives across different stages, comparing value and benefits across multiple ideas/initiatives, monitoring investment requirements, and supporting strategic decision-making.
Note: Users need the View All Ideas/Initiatives Report permission enabled in their role under Reports to be able to access and use this report. If you cannot view this report, please contact your system administrator to verify your permissions.

Accessing the All Ideas/Initiatives Report
To access the All Ideas Report:
- Navigate to the Reports module from the top navigation bar
- Select All Ideas/Initiatives from the list of available reports under Ideas/Initiatives group

- The report will display with default filters applied (Report Type set to "All"), showing all ideas/initiatives in a table format
Understanding the Report
The All Ideas/Initiative Report consists of a table displaying comprehensive information about all ideas/initiatives in the system.
Table Columns
The report displays the following information in table format: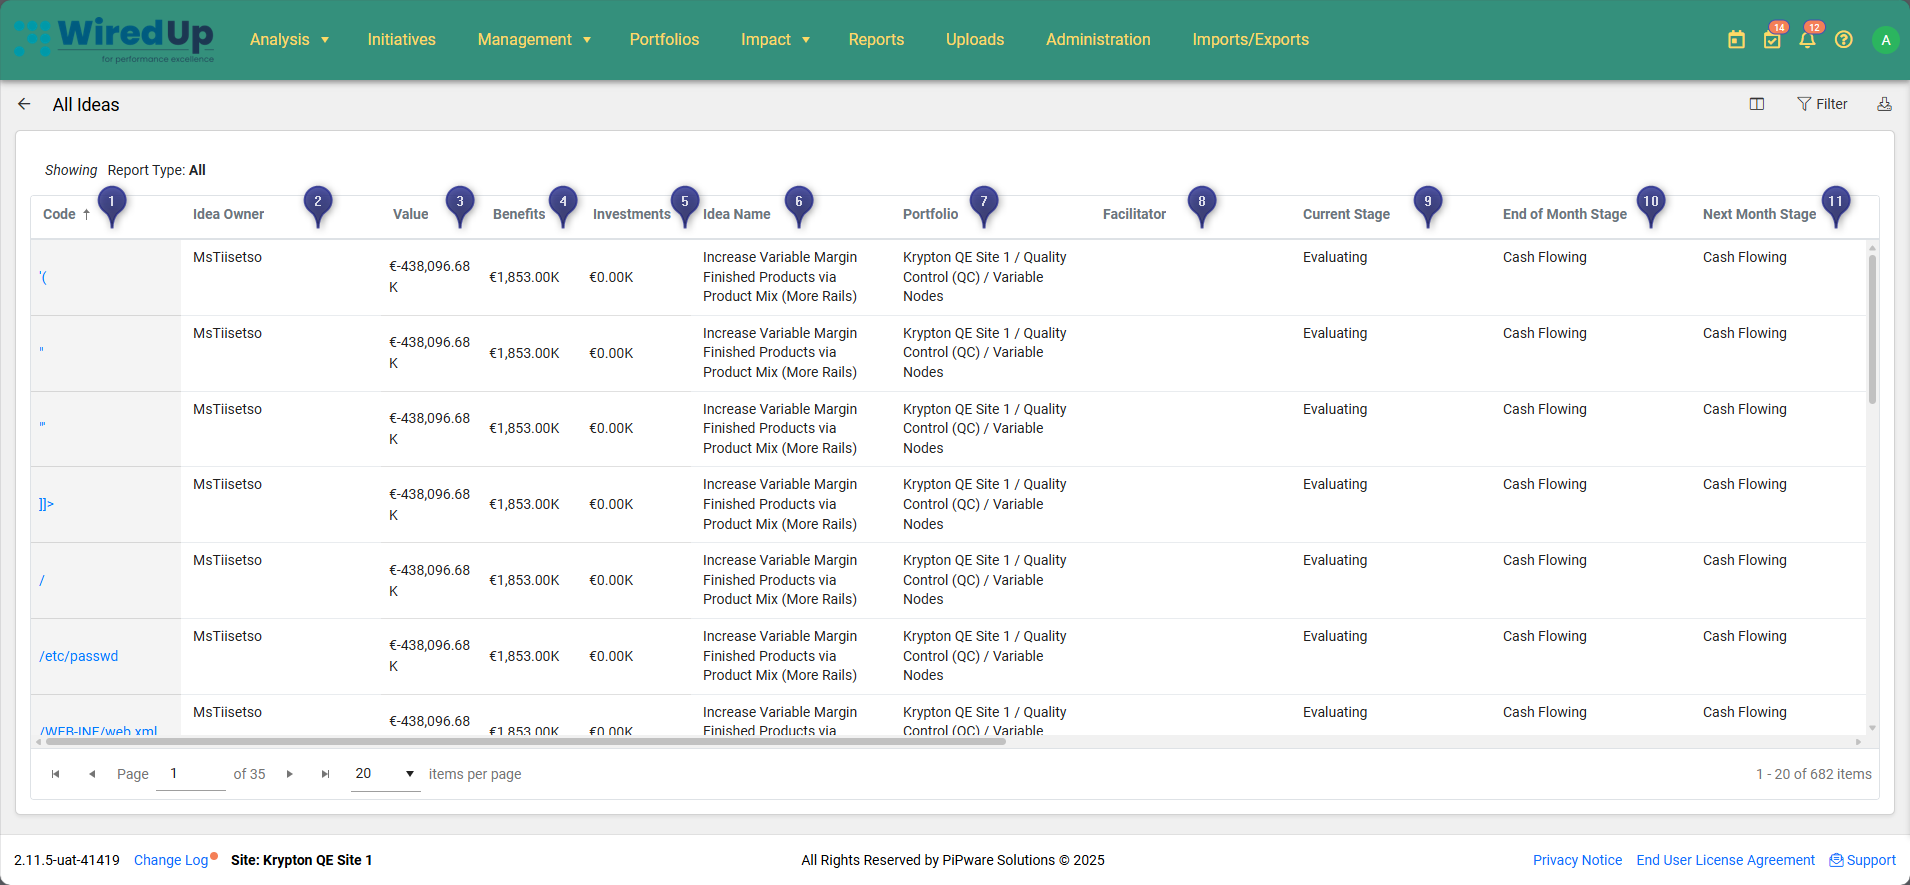
- Code: Unique identifier for the idea/initiative. Click on the code to navigate directly to the idea/initiative details
- Idea/Initiative Owner: The person responsible for the idea/initiative
- Value: The initiative value from the Idea/Initiative Overview
- Benefits: The actual benefit value from Idea/Initiative Benefits
- Investments: The actual Cash In and Cash Out values from Idea/Initiative Cashflow
- Idea/Initiative Name: The name or title of the idea/initiative
- Portfolio: The portfolio, department, or site to which the idea/initiative belongs, including the full organizational hierarchy
- Facilitator: The person facilitating the idea/initiative
- Current Stage: The current pipeline stage of the idea/initiative (e.g., Evaluating, Implementing, Cash Flowing, Locked In)
- End of Month Stage: The stage the idea/initiative is expected to reach by the end of the current month
- Next Month Stage: The stage the idea/initiative is forecasted to be in during the next month
Note: Additional columns can be added or removed using the Column Picker feature.
Table Features
- Sorting: Click on any column header to sort the table by that column (ascending or descending order)
- Column Picker: Customize which columns are displayed in the table
- Click the Column Picker icon to open the column selection panel
- Click the + icon next to a column name to add it to the table
- Click the - icon next to a column name to remove it from the table
- Additional custom fields can be added from the "Additional Fields" section
- Click Apply to save your column selections or Reset to return to default columns
- Pagination: Use the pagination controls at the bottom of the table to navigate through multiple pages of results
- Items per page: Adjust the number of items displayed per page using the dropdown menu (default is 20 items per page)
- Total count: The bottom right of the table displays the total number of ideas/initiatives
Report Filters
The All Ideas/Initiatives Report includes several filters to customize the data displayed. These filters appear in the Filter panel on the right side of the screen when you click the Filter button.
Applying and Clearing Filters:
- Click the Filter button (top-right corner) to apply your selected filter criteria
- Click the Clear button to reset all filters to their default values
- The default filter when opening the report is Report Type set to "All"
- Once filters have been applied, they will be displayed at the top of the report showing the selected filter criteria
Available Filters:

Report Type
- Select the type of ideas/initiatives to display
- Default setting shows "All" ideas/initiatives
- Allows you to filter by specific report categories
Portfolio
- Select the specific portfolio, department, or site to view
- Include Descendants checkbox: When enabled, includes all sub-portfolios and departments under the selected portfolio
- Allows you to focus on ideas/initiatives from specific organizational areas
Idea Definitions
- Filter by specific idea definition types configured in your system
- Default setting shows "All" idea definitions
- Useful for focusing on particular categories of ideas/initiatives
Idea Source
- Filter by the source or origin of the idea/initiative
- Default setting shows "All" sources
- Helps track ideas/initiatives from specific channels or origins
KPI Type
- Filter ideas/initiatives based on their associated KPI type
- Default setting shows "All" KPI types
- Helps narrow down ideas/initiatives linked to specific performance indicators
Tags
- Filter ideas/initiatives by associated tags
- Type to search for tags and press Enter to add
- Useful for analyzing ideas/initiatives with specific classifications or categories
More Filters
- Additional filtering options based on custom idea fields configured in your system's Administration settings under Administration > Ideas/Initiative Fields
- These filters are dynamically generated based on your organization's specific idea field configurations
Downloading the Report
The All Ideas Report can be exported for offline viewing, sharing, or further analysis:
- Click the Download button in the top-right corner of the report
- The report will be exported in Excel format
- The downloaded file will include all currently applied filters and all visible ideas/initiatives data with the selected columns
The Excel export allows you to:
- Perform additional analysis on ideas/initiatives data
- Share the report with stakeholders who may not have system access
- Track ideas/initiatives portfolio over time by saving periodic exports
- Create custom reports or presentations using the exported data
- Conduct detailed financial analysis on value, benefits, and investments
- Maintain historical records of ideas/initiatives portfolio
Best Practices
- Review the report regularly to maintain an overview of all ideas/initiatives in the portfolio
- Use the Column Picker to customize the view based on your specific analysis needs
- Sort by Value or Benefits to identify the highest-value ideas/initiatives in the portfolio
- Filter by Portfolio to analyze ideas/initiatives across different organizational areas
- Click on idea/initiative codes to navigate directly to detailed views for further investigation
- Monitor Current Stage to understand the distribution of ideas/initiatives across pipeline stages
- Use custom filters from More Filters to segment ideas/initiatives based on organization-specific criteria
- Download and archive reports periodically to maintain historical records of the ideas/initiatives portfolio
- Track stage progression by reviewing End of Month Stage and Next Month Stage columns
Related Articles
You may also find these related articles helpful:
- Ideas/Initiative Progress Report
- Ideas Pipeline By Department Report
- Pipeline Summary Report
- Idea/Initiative Overview