
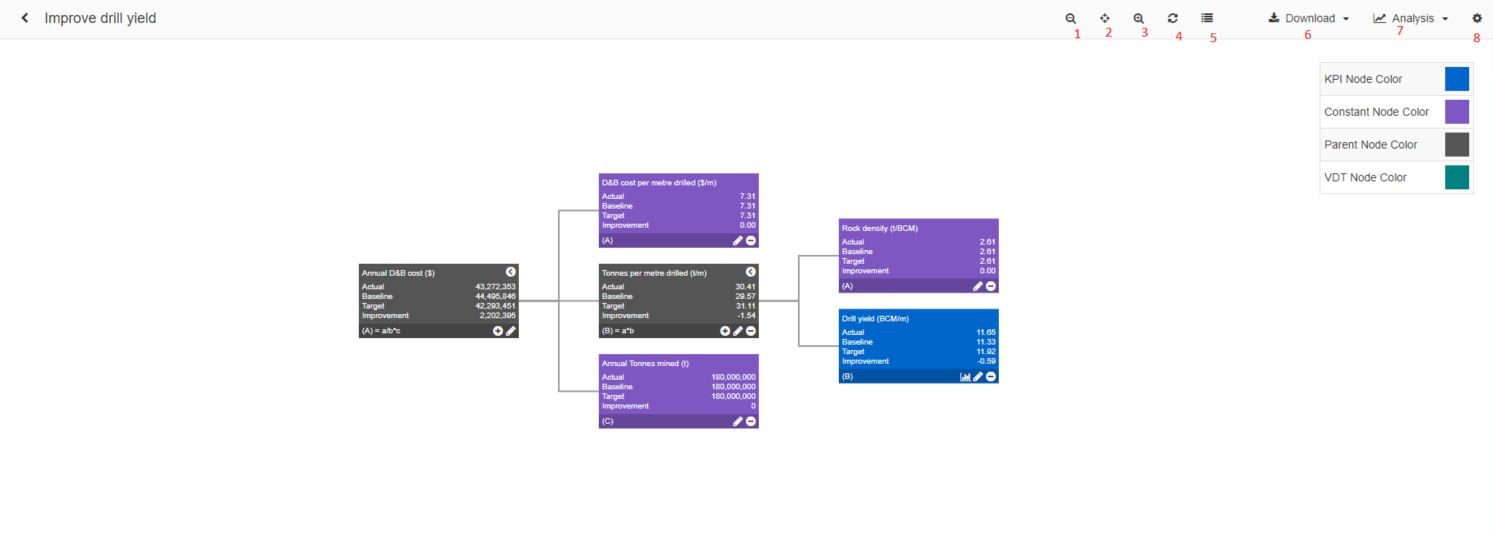
Once you create or edit a VDT, you will be taken to the following page:
Please note VDT changes are saved automatically.
- Zoom in – Increases the zoom level on the graph
- Reset zoom – Resets the zoom level to the default value
- Zoom out – Decreases the zoom level on the graph
- Refresh – Forces recalculation of the entire VDT values
- Enables VDT Legend and status colours display
- Downloads the current VDT in Excel format, with or without node comments
- Contains links to the following Analysis Pages:
- Sensitivity Analysis
- Attribution Analysis
- Variance Analysis
- What-If Analysis
- Goal Seek
- Interactive Goal Seek
- Navigates to the VDT Edit Page