The Sensitivity Analysis report shows which input KPI’s have the biggest impact on a VDT’s outcome value. It calculates this by adjusting each KPI value by a fixed percentage and comparing the effect this has on the VDT result to that of the other KPI’s.
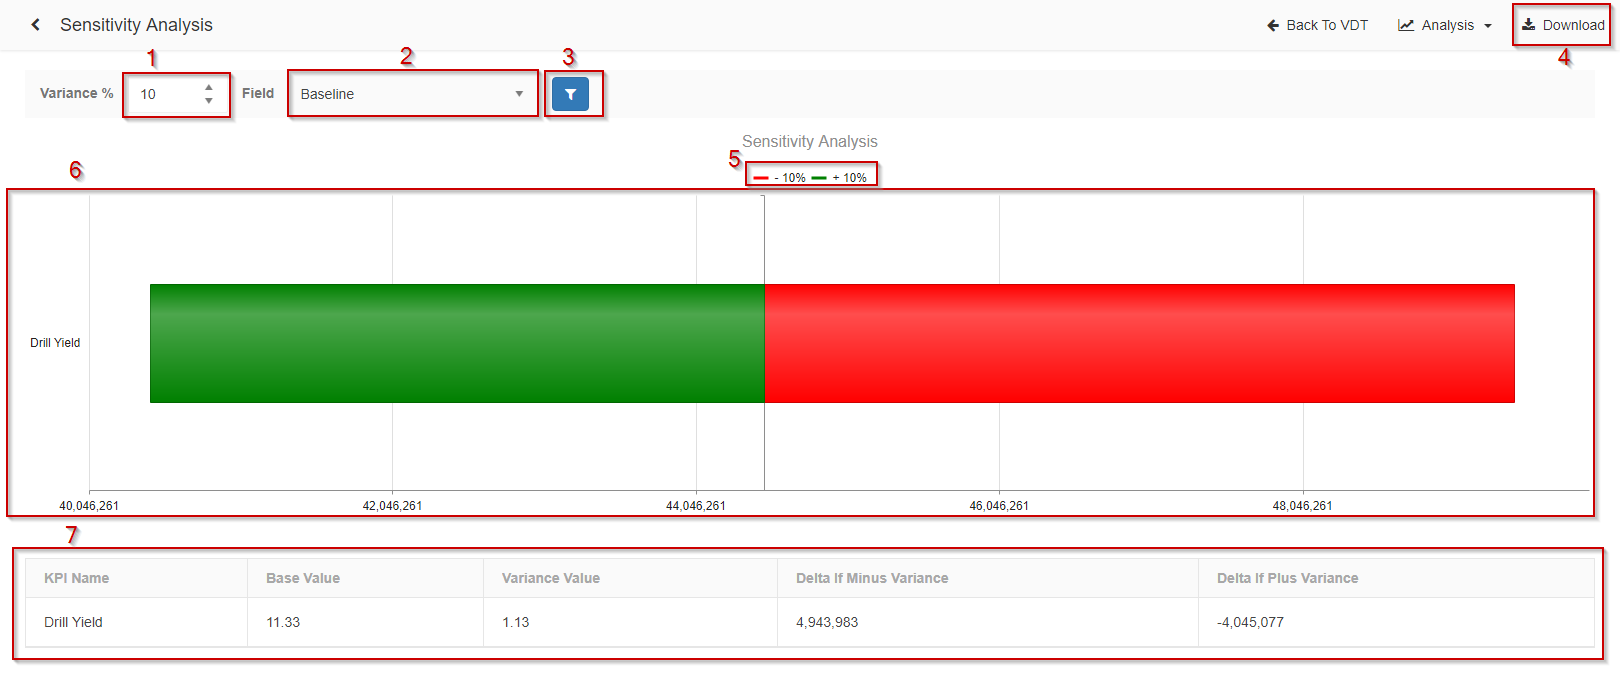
- The percentage value entered is applied to all KPI’s in the VDT, in order to ascertain the impact that increasing and decreasing the KPI value by this amount would have on the output value
- The selected field’s value will be used as the base value for impact calculations
- Re-runs the report using the percentage and field values that are currently entered
- Exports the report data to Excel format
- Series on the chart can be toggled on/off via the legend
- The graph visually indicates the impact that modifications to a KPI value has on the outcome of the VDT. The impact values are ordered from largest impact to smallest impact
- This table contains the variance values applied and the resulting net impact on the VDT result