
In this article
Overview
This section allows you to configure how the captured KPI values will be displayed on the chart. KPI charts play a vital role in helping businesses measure, track, and enhance their performance. They provide actionable insights, support data-driven decision-making, and improve communication, ultimately contributing to the overall success and sustainability of the organization.
KPI Chart
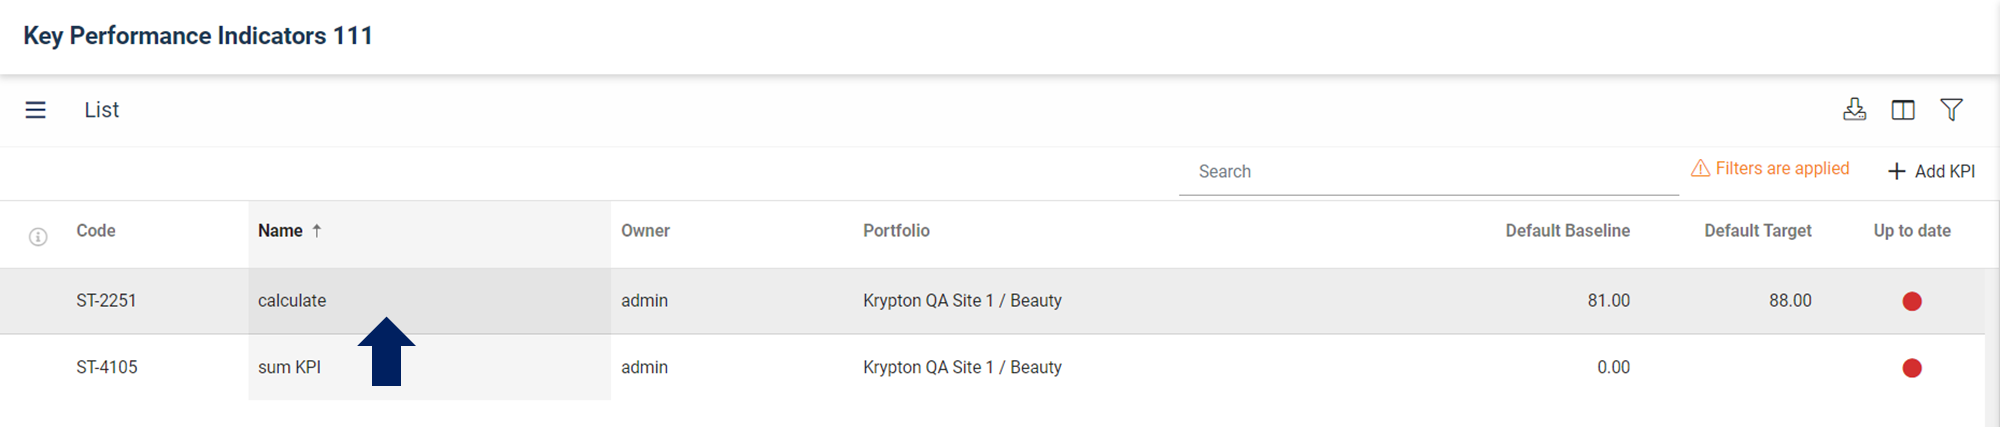
The KPI Chart displays once you click on the KPI name. Alternatively, you can click on the three-bar menu and click on Chart. The KPI Chart displays the values that were captured in the KPI Values section. All the values take into consideration the unit of measures display factor; chart value = captured value * UoM display factor.

The Dates and Bars on the chart correspond to the date range selected on the summary area displayed to the right side of the screen, with the selected date being the last date shown on the chart. The color scheme at the bottom of the screen indicates the specific time frame's color display. The line on the chart reflects the values relative to the Baseline value, while another line reflects the values relative to the Target value. The summary section, which appears on the right side of the screen, is calculated based on the selected Performance Period; you can change the performance period in the Chart Options panel. Read more here: KPI Chart Options
Note: In order for the status to be calculated, an Actual value for the performance period is required; no actual value will display in grey with N/A variance.

Green Status
An actual value was captured and performance is better than the target, resulting in a positive variance calculated. For example, an upward tending KPI with a target of 90 and a captured actual of 100 will result in a variance of 10.

Red Status
An actual value was captured and performance is below target, resulting in a negative variance calculated. For example, an upward trending KPI with a target of 100 and a captured actual of 90 will result in a variance of -10.
Hint: KPI Charts will display custom target lines as well for KPIs that have custom targets. To show/hide custom targets on the chart, use the "Display Custom Targets" option found in the KPI Chart options panel.Next Steps
Now that the KPI Chart has now been configured, for further reading on KPIs see: KPI Tools.