
In this article
Overview
What is Idea/Initiative Benefits?
Key Components of Idea Benefits
- Benefit Calculation Methods
- Benefit Duration
- Financial and Non-Financial Benefits
- Benefit Forecasting
- Cashflow Integration
Affected Areas
- Dashboards Widgets and Idea/Initiative Widgets
- Reports
- APIs
- Import/Export Module
- Administration Settings
Recommendations
Summary
Overview
Idea Benefits in WiredUp is a powerful feature that enables organizations to track, forecast, and report on the financial and non-financial value delivered by initiatives throughout their lifecycle. This feature provides comprehensive benefit tracking capabilities, allowing teams to monitor actual performance against targets, forecast future benefits, and make data-driven decisions about their improvement pipeline.
The Idea/Initiative Benefits are located on the 3-bar menu within the Idea/Initiative

What is Idea/Initiative Benefits?
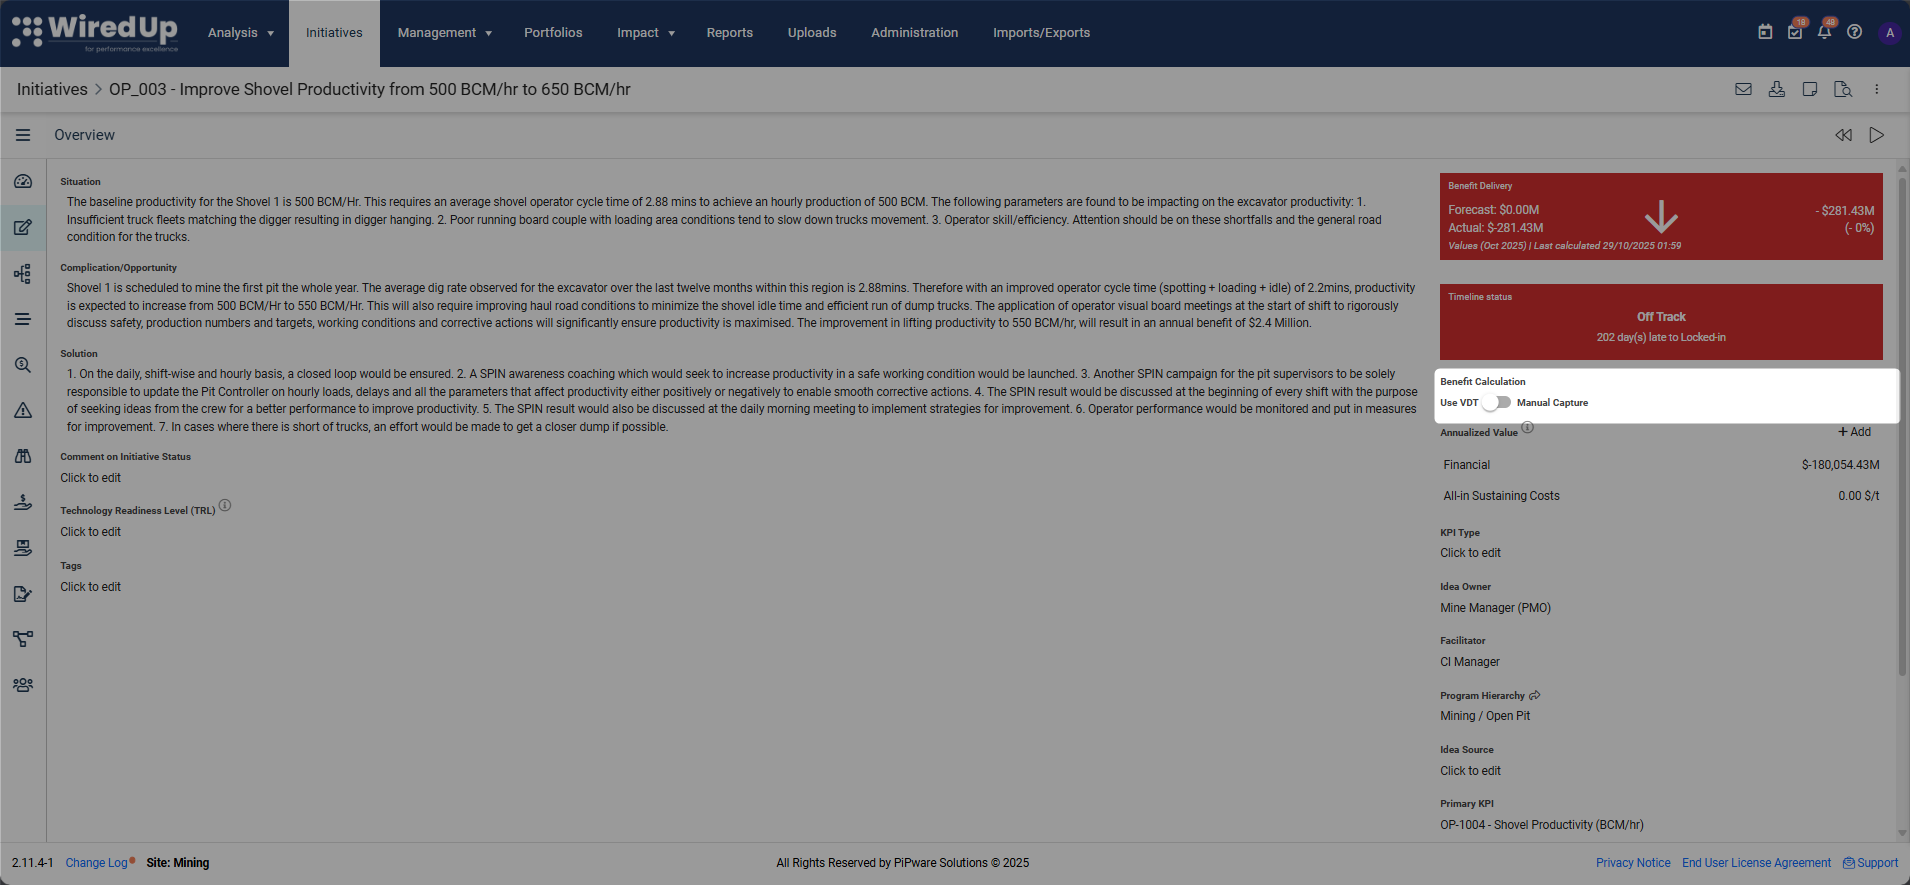
Idea/Initiative Benefits represent the value that an initiative is expected to deliver, calculated either through:
- Manual Capture: Directly entering benefit values and annualized targets
- Allows users to directly input the annualized/improvement value or monthly benefit value depending on calculation method
- Enables manual entry of actual monthly benefits
- Suitable for initiatives where automated calculation is not feasible
- VDT Capture: Using Value Driver Trees with linked KPIs to automatically calculate benefits based on actual performance data
- Automatically calculates benefits based on Value Driver Tree nodes
- Links to KPIs for real-time performance tracking
- Provides detailed breakdown of benefit sources through parent and child nodes
- Calculation differs based on whether Annualized or Monthly method is active
These benefit calculation setting is configured on the Idea/Initiative Overview section of the idea/initiative
Key Components of Idea Benefits
Benefit Calculation Methods
WiredUp offers two distinct benefit calculation methods that determine how benefits are computed and displayed throughout the system:
- Annualized Benefit Calculation Method (Default)
- This is the default calculation method used in WiredUp
- Calculates benefits on an annualized basis and distributes them across months
- Monthly VDT values appear as 'Annualized Benefit' in the Idea Benefit Grid
- Monthly Benefit Calculation Method
- Provides more granular, month-by-month benefit tracking
- Must be activated by a site administrator (not enabled by default)
- Monthly VDT values appear as 'Benefit for Month' in the Idea Benefit Grid
- Displays exact monthly benefit amounts without annualization conversions
For detailed information on how each calculation method works, including formulas and calculation summaries, see the dedicated articles:

        • Annualized Benefit Calculation Method
        • New Monthly Benefit Calculation Method
Benefit Duration
The Benefit Duration defines when an initiative will start and end calculating benefits. The Benefit Duration is configured within the Benefit section after selecting the Benefit Duration icon:

There are 3 options of Benefit Start Dates available:
- Manual capture: Select the desired date

- Stage date: Select the stage when benefits begin

- First forecast date: Use the earliest date where forecast values are captured
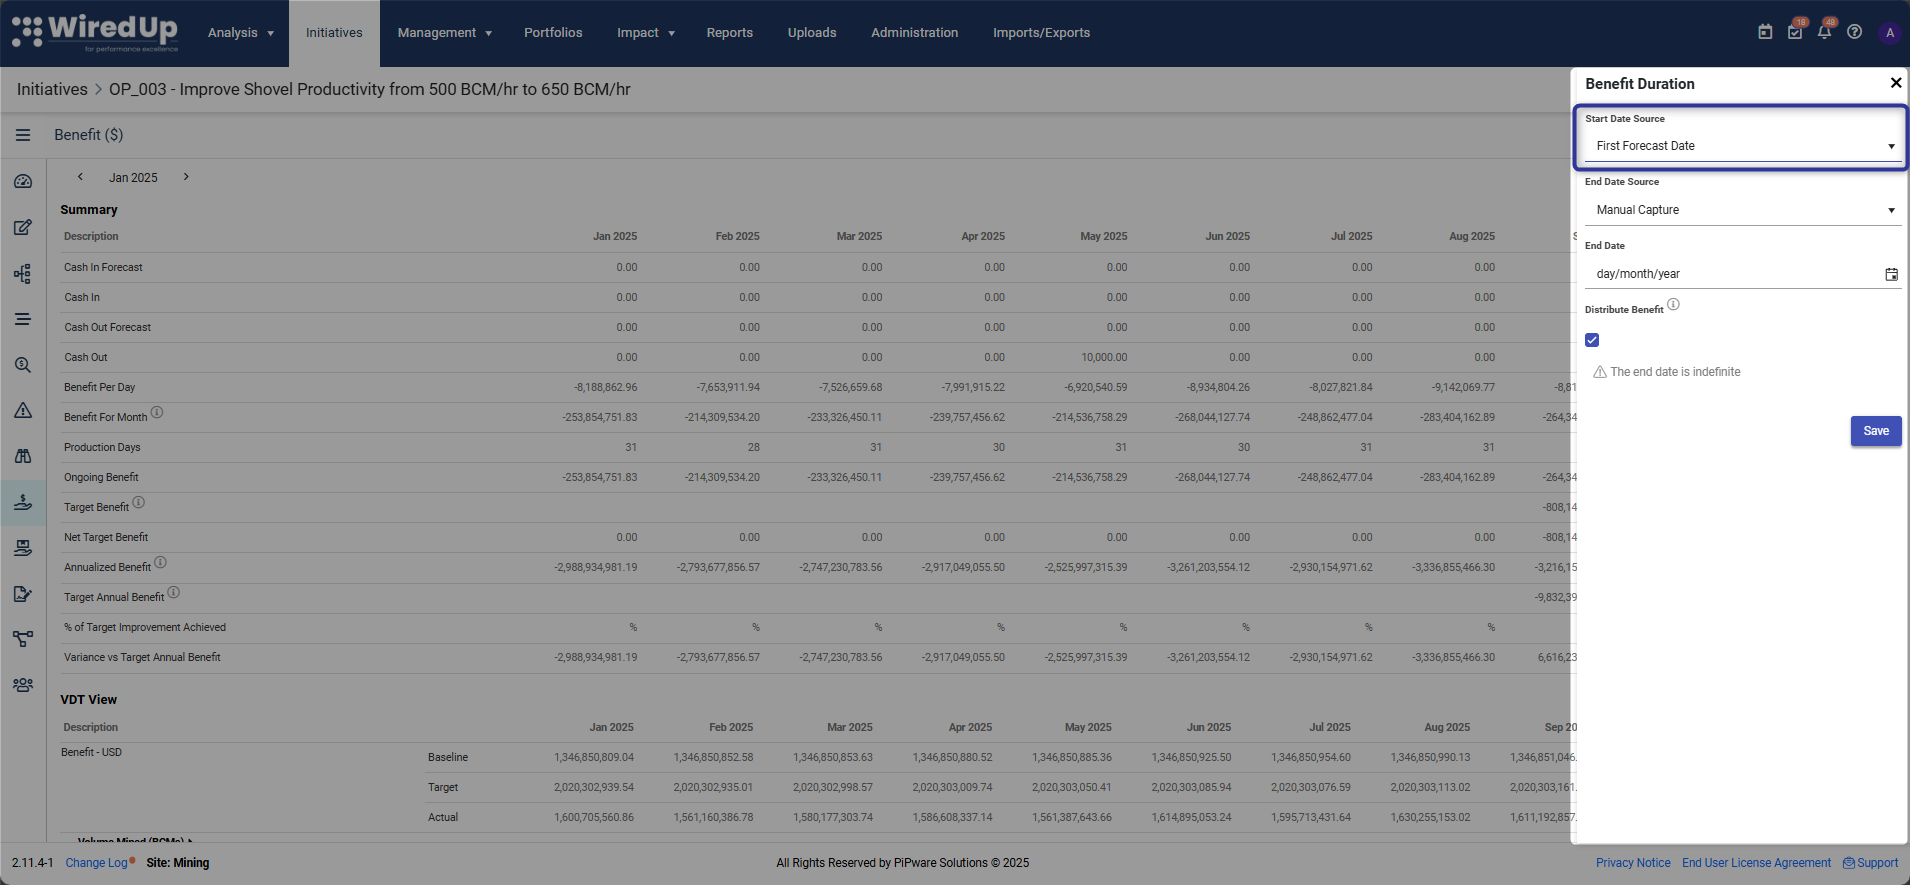
There are 3 available options for the Benefit End Date:
- Manual capture: Select the desired date

Based on start date: Capture the period in months
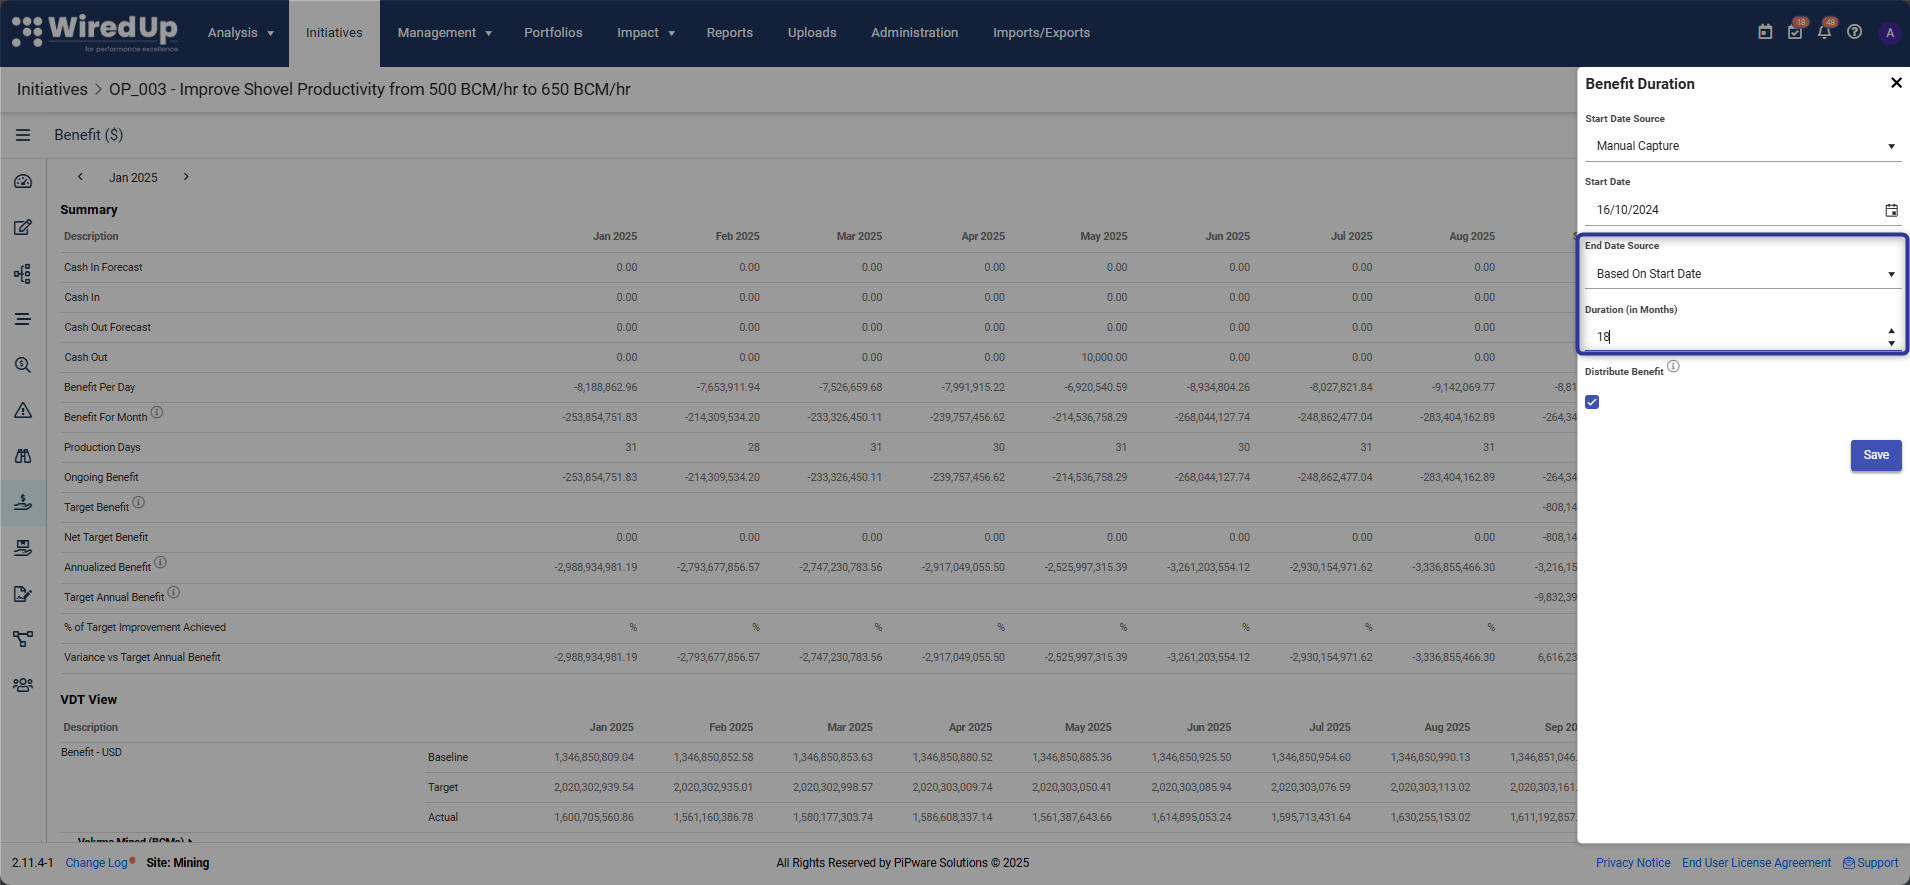
Ongoing: No end date (indefinite benefits)

Financial and Non-Financial Benefits
WiredUp supports tracking both financial and non-financial benefits:
- Financial Benefits:
- Monetary value delivered by the initiative
Non-Financial Benefits:
Includes non-financial metrics like emissions reduction, safety improvements, or customer satisfaction
Tracked through dedicated non-financial categories
Displayed in a separate benefit tab when configured
Values are sourced from Non-Financial parent nodes in VDTs, as well as entered manually on Manual Capture

Can use the same calculation method (Annualized or Monthly) as financial benefits
Benefit Forecasting
Benefit Forecasts are set on the idea/initiative Forecast menu.
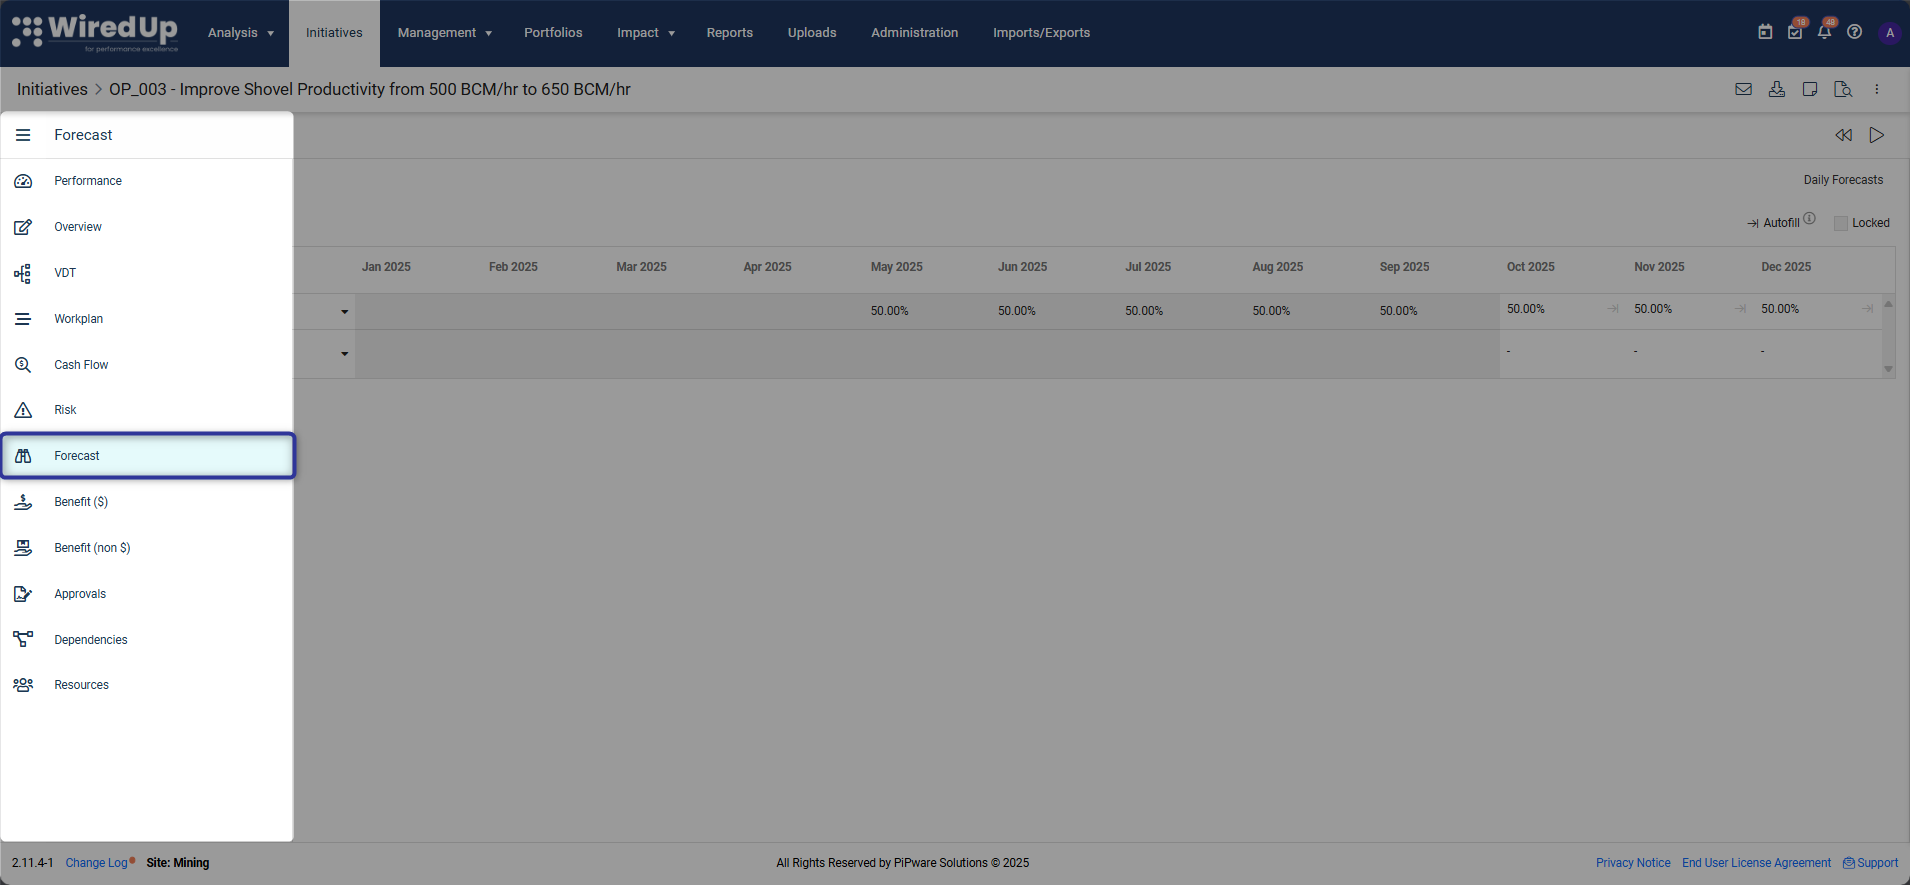 There are three forecast methods available:
- Forecast by Percentage: Specify the percentage of benefits to be realized
- Forecast by Amount: Direct entry of forecasted benefit amounts
- Actuals Forecast Values: Uses KPI actual forecast values for future periods
For more information on idea/initiative forecast, please see this article: Idea/Initiative Forecast
Benefit Grid View
- Allows users to directly input the annualized/improvement value or monthly benefit value depending on calculation method
- Enables manual entry of actual monthly benefits
- Suitable for initiatives where automated calculation is not feasible
- Automatically calculates benefits based on Value Driver Tree nodes
- Links to KPIs for real-time performance tracking
- Provides detailed breakdown of benefit sources through parent and child nodes
- Calculation differs based on whether Annualized or Monthly method is active
- This is the default calculation method used in WiredUp
- Calculates benefits on an annualized basis and distributes them across months
- Monthly VDT values appear as 'Annualized Benefit' in the Idea Benefit Grid
- Provides more granular, month-by-month benefit tracking
- Must be activated by a site administrator (not enabled by default)
- Monthly VDT values appear as 'Benefit for Month' in the Idea Benefit Grid
- Displays exact monthly benefit amounts without annualization conversions
• Annualized Benefit Calculation Method
• New Monthly Benefit Calculation Method
There are 3 available options for the Benefit End Date:
Based on start date: Capture the period in months
Ongoing: No end date (indefinite benefits)
- Monetary value delivered by the initiative
Non-Financial Benefits:
Includes non-financial metrics like emissions reduction, safety improvements, or customer satisfaction
Tracked through dedicated non-financial categories
Displayed in a separate benefit tab when configured
Values are sourced from Non-Financial parent nodes in VDTs, as well as entered manually on Manual Capture
Can use the same calculation method (Annualized or Monthly) as financial benefits
There are three forecast methods available:The Benefits Grid is available when you switch from Benefit Chart view to Benefit Grid view. The Grid view provides a detailed breakdown that includes:
- Summary Table: Monthly values, one-off values, ongoing benefits, target benefits, daily benefit, monthly benefit, and annualized benefit
- VDT Table: Breakdown of the VDT showing parent nodes (in bold) and child nodes (if Benefit Calculation is set to VDT Capture)
- Monthly Benefit Table: Benefit delivered for the month, forecast, and gap to forecast
- Cumulative Benefit Table: Total benefit delivered during the entire initiative duration
For detailed explanations of how each metric is calculated under each method, see:
        • What Do the Terms Used in an Idea/Initiative Mean? (for Annualized method)
        • Idea Benefit Grid Terms and Calculations (for Monthly method)
Cashflow Integration
The Idea/Initiative Cashflow feature is available on the idea/initiative Cashflow menu.

The idea/initiative Cashflow feature has replaced the previous One-off Benefit and One-off Cost tables, providing enhanced capabilities such as:- Named cashflow items for better tracking
- Monthly target and actual values
- Automatic calculation based on annual growth rates
- Integration with benefit calculations (works with both calculation methods)
- Support for multiple cashflow categories (Benefit, Opex, Capex)
For more information on the idea/initiative Cashflow feature, please see this article: Idea/Initiative Cashflow
Affected Areas
The Idea/Initiative Benefits feature impacts multiple areas across the WiredUp platform. The benefit calculation method selected affects how values are displayed and calculated across all these areas:
Dashboards Widgets and Idea/Initiative Widgets
- Benefit Delivery Idea/Initiative Widget

- Displays on Idea Performance and Overview pages
- Shows benefits delivered/forecasted for the current month
- Color-coded status (green = on track, red = off track, grey = no data)
- Calculates benefit delivered by subtracting forecast from actual benefit
- Total Benefits to Date Dashboard Widget
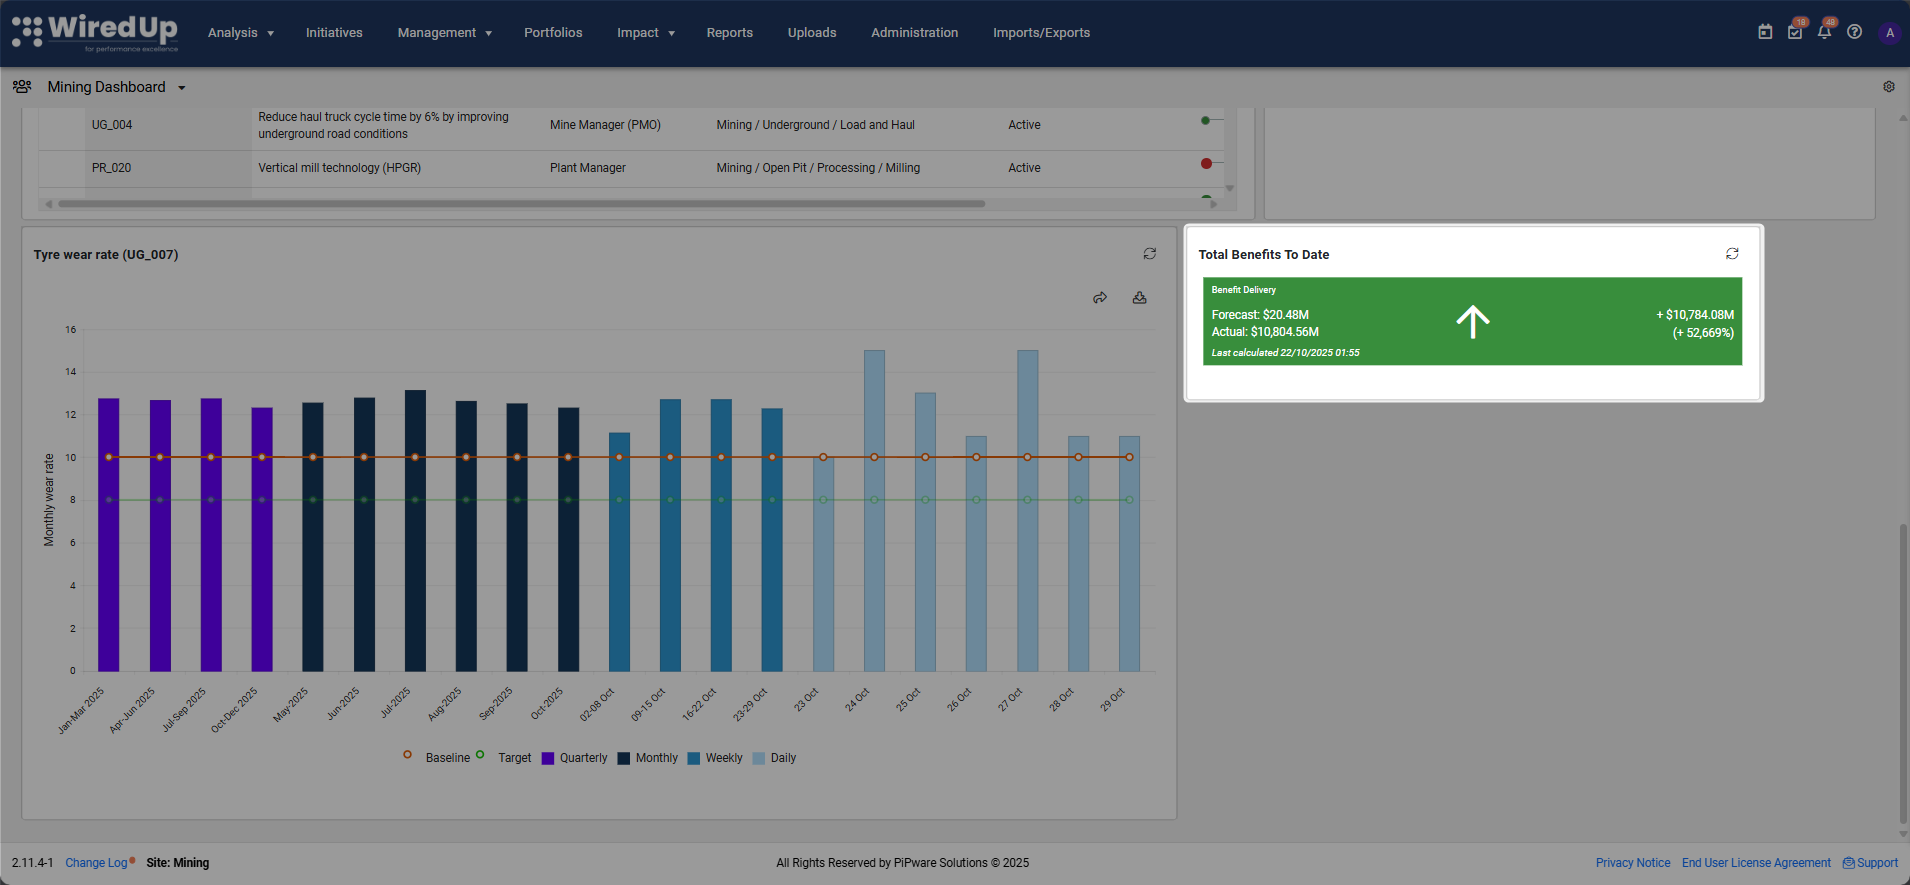
- Shows cumulative benefits delivered across the portfolio
- Takes into account all initiatives that are active, approved, or completed
- Uses the last actual/forecast value to date in the benefits table
- With Monthly method: Actual field uses Benefit for Month value; Forecast field uses Target Benefit value
- Portfolio Value Dashboard Widget

- Shows total value of selected portfolio
- Can display Initiative Total or Cumulative Benefit Total
- Allows selection of benefit type (financial or non-financial)
- Monthly Benefit Grid Calculation method applied when 'Value' field is set to 'Cumulative Benefits'
- Run Rate Benefits Idea/Initiative Widget
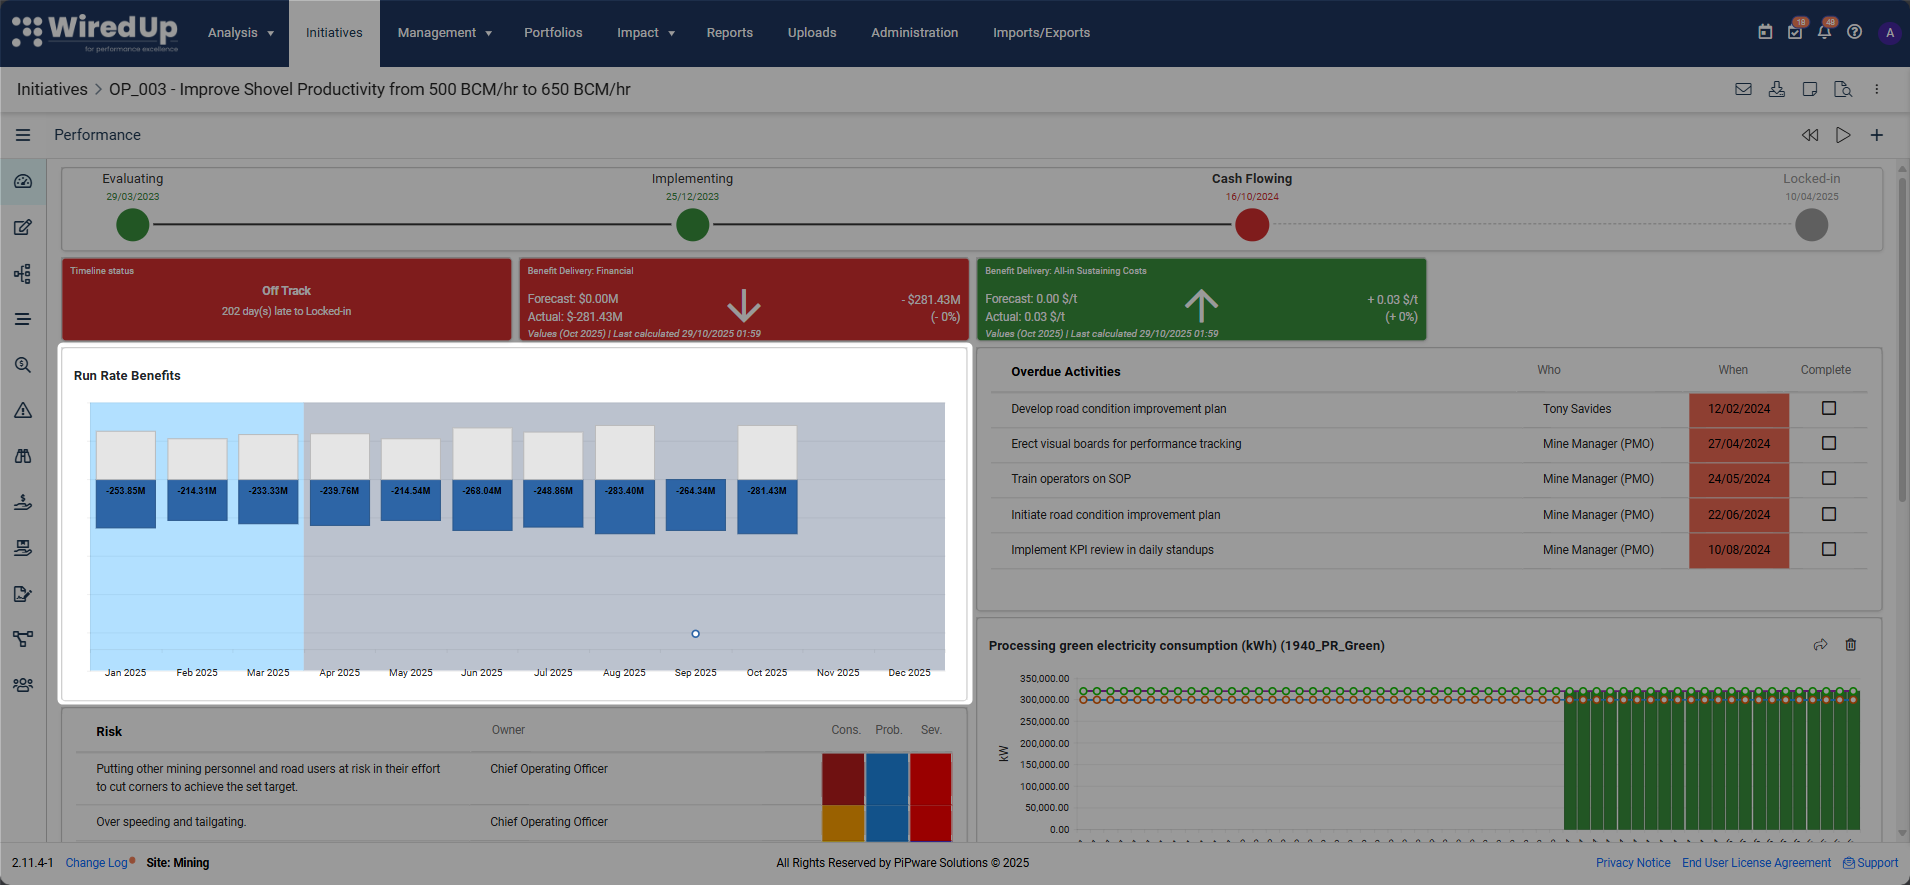
- Displays a copy of the chart on the idea/initiative Performance section from the Financial Benefit page
- Provides quick access to benefit trends
- Ideas/Initiative Dashboard Widget

- Can be configured to display ideas by stage, status, and benefit performance
- Allows filtering by benefit-related criteria
- Top 25 Ideas/Initiatives Widget
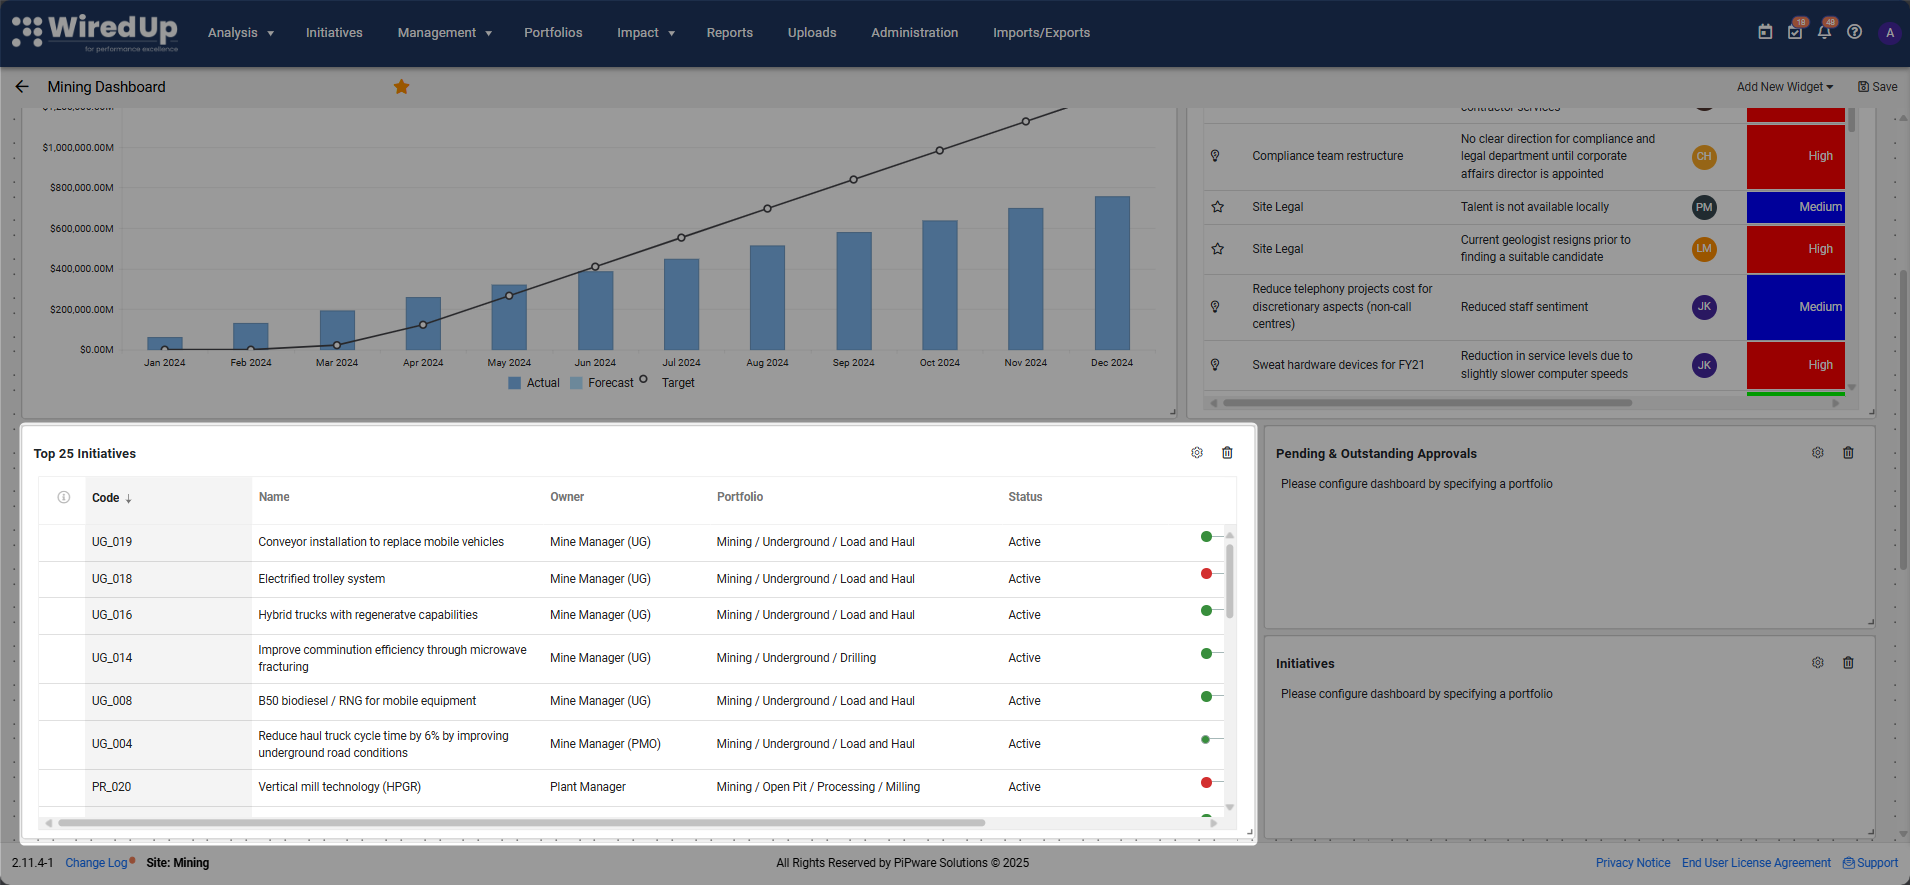
- Monthly Benefit Calculation applied when configured to show "Initiatives by Actual Benefit for current month" or "Initiatives by Actual Benefit for last month"
Reports
- Cumulative Benefits Report

- Shows total benefits delivered from ideas over time versus targets
- Displays both Actual Benefit Delivered and Cumulative Benefits Delivered charts
- Includes Monthly Gap sections showing department contributions and initiative-level gaps
- Integrates with Pipeline Targets for target line calculations
- With Monthly method: Ongoing/Benefit for Month, Target Benefit, Benefit YTD total, and YTD Forecast values reflect new benefit grid values
For more information on this report, please see this article: Cumulative Benefit Report
- Cumulative Pipeline Report

- Shows total pipeline value of initiatives in each stage gate versus targets
- Uses benefit target percentages from stage configuration
- Displays cumulative view of the pipeline for specified time periods
For more information on this report, please see this article: Cumulative Pipeline Report
- Benefit Contribution Report
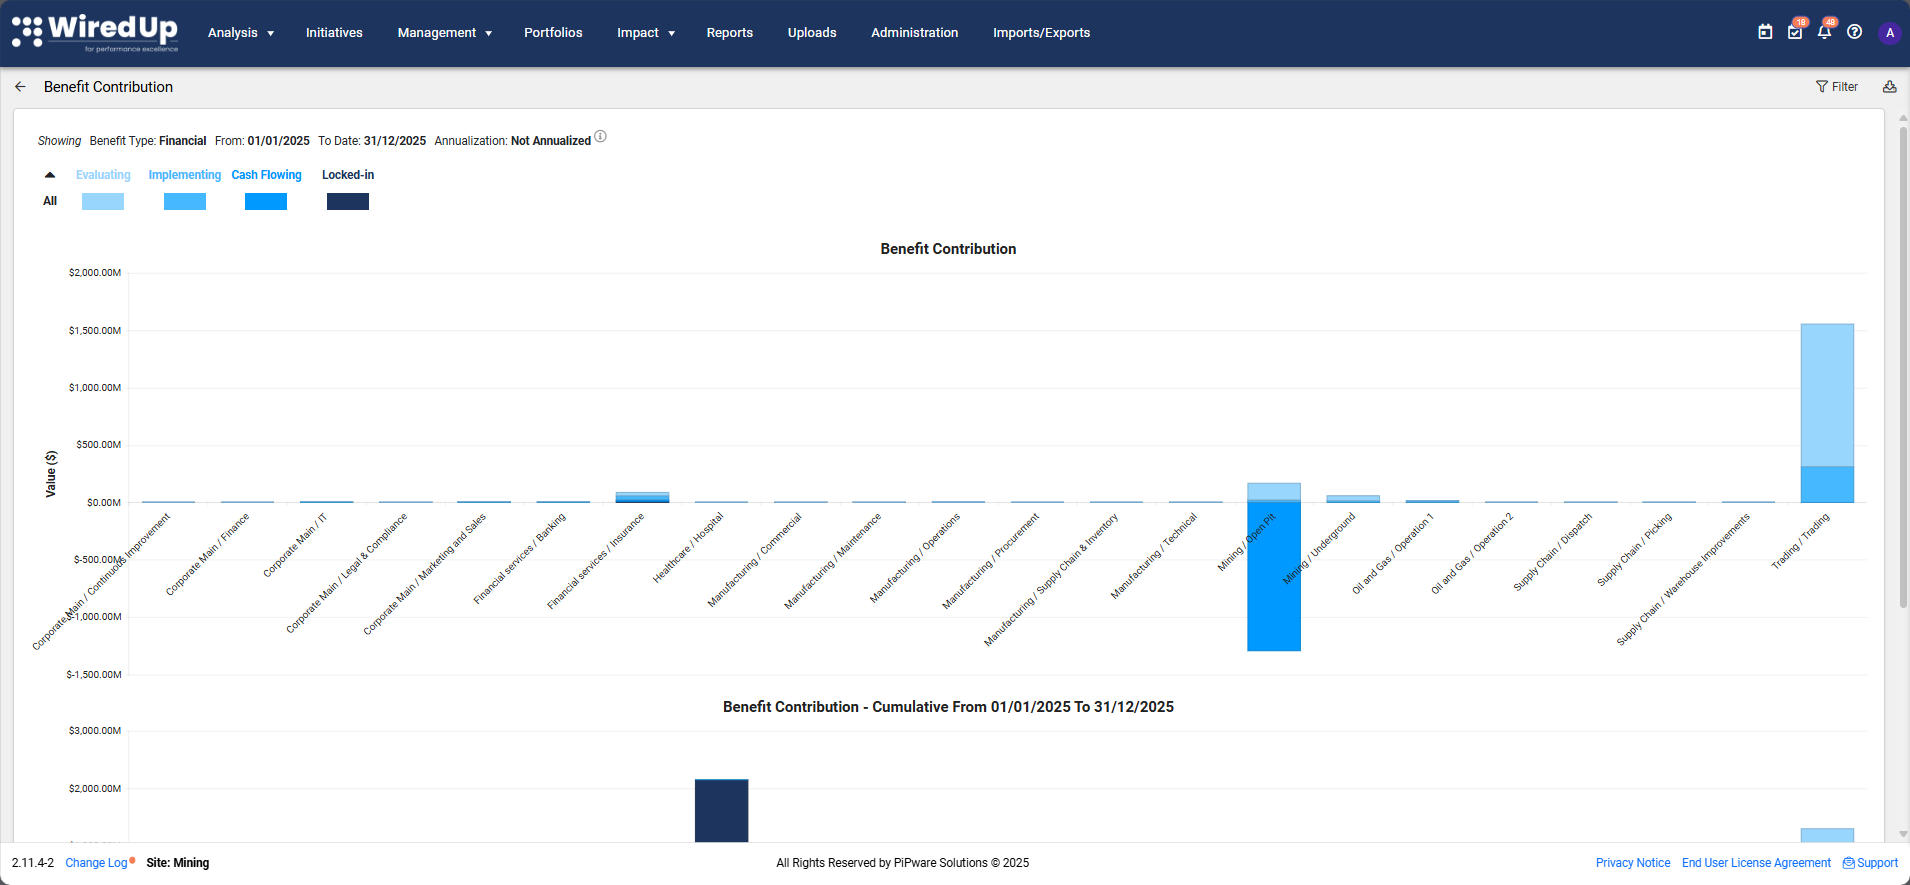
- Displays benefit contribution of ideas/initiatives per department and stage
- Provides two key chart views:
- Chart 1: Sum of entire Idea Value/Improvement value as initiatives progress through each stage
- Chart 2: Sum of actual benefit delivered per stage for each initiative
- Shows breakdown by department or portfolio level with color-coded bars for different stages
- Helps track value delivery and benefit distribution across the organization
For more information on this report, please see this article: Benefit Contribution Report
APIs
- /api/v4/BulkData/ideas - Provides annualized value
- /api/v4/BulkData/cumulativeBenefits - Provides actual benefit, target benefit, and forecast benefit; values returned depend on active calculation method
- Enables integration with external systems and custom reporting
For more information on these APIs, please see these articles: API Articles
Import/Export Module
- Supports import of actual monthly benefits
- Allows import of forecast values (percentage or amount)
- Enables cashflow actuals and forecast imports
- Facilitates bulk data updates across multiple initiatives
For more information on the Import/Export module, please see these articles: Import Templates
Administration Settings
- Benefit Calculation Method Setting
- Site-level setting to choose between Annualized or Monthly calculation method
- Located in Portfolios > Site Configuration > Settings > Ideas (PMO) or Administration > Organisational Structure > Site Configuration > Settings > Ideas (CI)
- Affects all active and approved ideas when switched
- Non-Financial Categories
- Maintained in Administration
- Linked to units of measure
- Used for non-financial benefit tracking across initiatives
- Calendar Configuration
- Located in Portfolios > Site Configuration > Settings (PMO) or Administration > Organisational Structure > Site Configuration > Settings (CI)
- Default calendar determines production days
- Production days used in benefit per day calculations
- Impacts monthly benefit calculations
- Critical for both Annualized and Monthly calculation methods
Recommendations
To effectively use Idea/Initiative Benefits in WiredUp:
- Understand Your Calculation Method: Determine whether your organization uses the Annualized or Monthly benefit calculation method, as this affects how benefits are calculated and displayed throughout the system
- Configure Your Initiative for Benefit Tracking: Set up annualized value (for manual capture), VDT (for VDT capture), workplan dates, benefit duration, and benefit calculation method
- Understand Benefit Calculations: Familiarize yourself with how different benefit metrics are calculated under your active calculation method
- Set Up Forecasting: Choose the appropriate forecast method (percentage, amount, or KPI actuals forecast) based on your needs
- Monitor Performance: Use dashboards and reports to track benefit delivery against targets
- Leverage VDTs: For complex initiatives, use Value Driver Trees with linked KPIs for automated benefit calculations
- Review Affected Areas: Review how benefit data flows through reports, dashboards, and other modules
Summary
Aspect
Description
Purpose
Track, forecast, and report on financial and non-financial value delivered by initiatives throughout their lifecycle
Primary Functions
- Calculate initiative benefits
- Monitor actual performance vs. targets
- Forecast future benefits
- Support data-driven decision making
Calculation Methods
- Annualized Method (default): Distributes benefits across months from annual value
- Monthly Method: Tracks exact month-by-month benefits
Capture Methods
- Manual Capture: Direct entry of benefit values
- VDT Capture: Automated calculation via Value Driver Trees linked to KPIs
Benefit Types Supported
- Financial benefits (monetary value)
- Non-Financial benefits (emissions, safety, customer satisfaction, etc.)
Key Features
- Benefit duration configuration (start/end dates)
- Multiple forecasting methods (percentage, amount, KPI actuals)
- Cashflow integration (Opex, Capex, Benefits)
- Variable baselines and targets from KPIs
- Detailed benefit grid with VDT breakdown for VDT Capture
Reporting Capabilities
- Cumulative Benefits Report
- Cumulative Pipeline Report
- Benefit Contribution Report
- Initiative Pipeline Summary Report
- API integration
- Export to PDF/Excel
Dashboard Widgets
- Total Benefits to Date
- Portfolio Value
- Ideas Widget
- Top 25 Initiatives
Idea Widgets
- Benefit Delivery Widget (on Performance and Overview pages)
- Run Rate Benefits Widget (on Performance page)
Calculation Drivers
- Production Days (from calendar)
- Benefit Duration (days between start and end)
- Stage dates (from workplan)
- Forecast percentages (from stage configuration or manual entry)
Common Use Cases
- Track ROI of improvement initiatives
- Monitor benefit delivery against targets
- Forecast future value delivery
- Report on portfolio performance
- Identify underperforming initiatives
- Demonstrate financial impact to stakeholders
• What Do the Terms Used in an Idea/Initiative Mean? (for Annualized method)
• Idea Benefit Grid Terms and Calculations (for Monthly method)
- Displays on Idea Performance and Overview pages
- Shows benefits delivered/forecasted for the current month
- Color-coded status (green = on track, red = off track, grey = no data)
- Calculates benefit delivered by subtracting forecast from actual benefit
- Shows cumulative benefits delivered across the portfolio
- Takes into account all initiatives that are active, approved, or completed
- Uses the last actual/forecast value to date in the benefits table
- With Monthly method: Actual field uses Benefit for Month value; Forecast field uses Target Benefit value
- Shows total value of selected portfolio
- Can display Initiative Total or Cumulative Benefit Total
- Allows selection of benefit type (financial or non-financial)
- Monthly Benefit Grid Calculation method applied when 'Value' field is set to 'Cumulative Benefits'
- Displays a copy of the chart on the idea/initiative Performance section from the Financial Benefit page
- Provides quick access to benefit trends
- Can be configured to display ideas by stage, status, and benefit performance
- Allows filtering by benefit-related criteria
- Monthly Benefit Calculation applied when configured to show "Initiatives by Actual Benefit for current month" or "Initiatives by Actual Benefit for last month"
- Shows total benefits delivered from ideas over time versus targets
- Displays both Actual Benefit Delivered and Cumulative Benefits Delivered charts
- Includes Monthly Gap sections showing department contributions and initiative-level gaps
- Integrates with Pipeline Targets for target line calculations
- With Monthly method: Ongoing/Benefit for Month, Target Benefit, Benefit YTD total, and YTD Forecast values reflect new benefit grid values
- Shows total pipeline value of initiatives in each stage gate versus targets
- Uses benefit target percentages from stage configuration
- Displays cumulative view of the pipeline for specified time periods
- Displays benefit contribution of ideas/initiatives per department and stage
- Provides two key chart views:
- Chart 1: Sum of entire Idea Value/Improvement value as initiatives progress through each stage
- Chart 2: Sum of actual benefit delivered per stage for each initiative
- Shows breakdown by department or portfolio level with color-coded bars for different stages
- Helps track value delivery and benefit distribution across the organization
- Site-level setting to choose between Annualized or Monthly calculation method
- Located in Portfolios > Site Configuration > Settings > Ideas (PMO) or Administration > Organisational Structure > Site Configuration > Settings > Ideas (CI)
- Affects all active and approved ideas when switched
- Maintained in Administration
- Linked to units of measure
- Used for non-financial benefit tracking across initiatives
- Located in Portfolios > Site Configuration > Settings (PMO) or Administration > Organisational Structure > Site Configuration > Settings (CI)
- Default calendar determines production days
- Production days used in benefit per day calculations
- Impacts monthly benefit calculations
- Critical for both Annualized and Monthly calculation methods
Aspect
Description
Purpose
Track, forecast, and report on financial and non-financial value delivered by initiatives throughout their lifecycle
Primary Functions
- Calculate initiative benefits
- Monitor actual performance vs. targets
- Forecast future benefits
- Support data-driven decision making
Calculation Methods
- Annualized Method (default): Distributes benefits across months from annual value
- Monthly Method: Tracks exact month-by-month benefits
Capture Methods
- Manual Capture: Direct entry of benefit values
- VDT Capture: Automated calculation via Value Driver Trees linked to KPIs
Benefit Types Supported
- Financial benefits (monetary value)
- Non-Financial benefits (emissions, safety, customer satisfaction, etc.)
Key Features
- Benefit duration configuration (start/end dates)
- Multiple forecasting methods (percentage, amount, KPI actuals)
- Cashflow integration (Opex, Capex, Benefits)
- Variable baselines and targets from KPIs
- Detailed benefit grid with VDT breakdown for VDT Capture
Reporting Capabilities
- Cumulative Benefits Report
- Cumulative Pipeline Report
- Benefit Contribution Report
- Initiative Pipeline Summary Report
- API integration
- Export to PDF/Excel
Dashboard Widgets
- Total Benefits to Date
- Portfolio Value
- Ideas Widget
- Top 25 Initiatives
Idea Widgets
- Benefit Delivery Widget (on Performance and Overview pages)
- Run Rate Benefits Widget (on Performance page)
Calculation Drivers
- Production Days (from calendar)
- Benefit Duration (days between start and end)
- Stage dates (from workplan)
- Forecast percentages (from stage configuration or manual entry)
Common Use Cases
- Track ROI of improvement initiatives
- Monitor benefit delivery against targets
- Forecast future value delivery
- Report on portfolio performance
- Identify underperforming initiatives
- Demonstrate financial impact to stakeholders
Related Articles
For more detailed information, refer to the following related articles:
Annualized Benefit Calculation Method
New Monthly Benefit Calculation Method
Idea/Initiative Performance
Idea/Initiative VDT
What Do the Terms Used in an Idea/Initiative Mean?
Cumulative Benefits Report
Annualized Benefit Calculation Method
New Monthly Benefit Calculation Method
Idea/Initiative Performance
What Do the Terms Used in an Idea/Initiative Mean?
Cumulative Benefits Report